The Difference Between Space for Parking and Space for People

This is a quick look at how much more space cars take up than people, visualized. While the context here is a street, think of it as a parking lot for a moment. Then, as you think about how to enhance what we love about downtown Carrboro, think about whether we need to focus on providing more parking downtown, or improving other ways to get there.  See you tonight at the Carrboro Parking kickoff!

200-ppl-177-cars200-ppl-not-in-cars200-ppl-on-bikes200-ppl-three-buses

Carrboro Parking Study Needs Your Input Thursday Eve (Feb 11th)

If you care about having choices in how to get to and enjoy downtown Carrboro, it is very important that you attend the Carrboro Parking Study Kickoff Meeting at Carrboro Elementary school Thursday evening from 6:00 to 8:00 p.m.

I’ll be there to share a simple message, and I invite you to join me to reinforce it.  That message is:

"THIS STUDY WILL BE MOST SUCCESSFUL IF IT FOCUSES ON A BROAD GOAL OF IMPROVING ***ACCESS FOR PEOPLE*** TO DOWNTOWN CARRBORO, AND CONSIDERS PARKING ONE OF SEVERAL TOOLS TO REACH THAT GOAL."I apologize for going large font on everyone, but really, this is the heart of the matter. People love downtown Carrboro because it is full of life, energy, commerce, culture, food, art, music, protest, you name it. And all of those great things come from PEOPLE. Some of them happen to come downtown in cars, but really, it’s the PEOPLE that make the magic. Cars don’t have wallets and shop in our stores. Cars don’t play in local bands in our venues. Cars don’t wait tables in our restaurants. PEOPLE do. The town staff, fortunately, seem to get this. From a 2013 staff memo sent to the Board of Aldermen:

In, Parking Evaluation, Evaluating Parking Problems, Solutions, Costs, and Benefits, a publication from the Victoria Transport Institute, the author notes, “A problem correctly defined is a problem half solved.” As the Board continues to refine its overall parking objective–from the continuum of creating a greater number of parking spaces, to encouraging more consumers to the downtown, to reducing the number of existing parking spaces, to removing automobiles from the downtown and thereby reducing the Town’s carbon footprint—it may become easier to frame potential policy changes and LUO text amendments.

Citizens need to encourage the Board of Aldermen to continue in this direction described in the staff memo. Here are a few strategic initiatives to consider that could move us in this direction.

  1. The People Who Drive Downtown Most Often (and Stay the Longest) Represent the Biggest Potential Pool of Parking Spaces to Free Up: Employees If we can identify what barriers keep downtown Carrboro employees from coming to downtown by means other than a car, and address those- we can get all those people to work and free up a lot of parking capacity downtown without adding a single new space. The most obvious example here is that we have 33 restaurants and bars downtown, and while most places finish serving dinner in the 9:30 – 10:30 pm range, the bus service back to most in-town neighborhoods has a final trip leaving downtown before 9 pm. Workers may be able to bus in, but needing to drive home also necessitates driving in, and taking a parking space for the entire dinner shift in downtown.
  2. Recognize That Not Every Access Strategy Needs to Be Used by Everyone In Order for Everyone to Experience Better Access The more people with cars who sometimes drive to downtown that we can help try walking or biking downtown, the more parking will be available for folks driving in from places where biking, walking, or using transit are not as easy. On some days, those people who can walk or bike may still drive, but working to make sure walking and bike access is assured for those within a closer distance makes it more likely that parking spaces are open for those coming from further away, or those not on a bus line.
  3. Consider the Power of Many Small Changes Let’s consider a downtown employer with 10 employees, all of whom drive to work every day. Generally speaking, that employer will have a much easier time getting all ten of them to find a way to only drive 4 out of 5 days instead of getting two of them to stop driving downtown altogether. Either approach still reduces this group of ten’s collective demand for downtown parking by 20 percent. I doubt that there is any single strategy that will solve the downtown access issue, but a host of strategies that all temper parking demand by 3% here and 6% there can cumulatively have a big impact.
  4. Identify the Ways That Parking Pricing Is Superior to Aggressive Towing, and Explain Those Benefits to Residents, Businesses, and Visitors If we charge for parking, and do it in a smart, technology-driven way, we get all of these benefits:
  • Gives visitors to downtown more choice in how long they shop
  • Costs taxpayers less to enforce than enforcing free 2-hour parking
  • Prevents all-day Park & Ride Parking to UNC in town lots
  • Makes it possible to find a lot with many open spaces online or by smartphone
  • Makes it more likely that visitors to downtown find a space easily
  • Reduces cruising for parking which leads to increased congestion and emissions downtown
  • Generates potential revenue for improvements that expand bicycle, pedestrian, and bus access to downtown
  • Helps generate revenue for businesses with parking when their business is closed


If you want more details about any of the benefits of Parking Performance Pricing, I wrote a detailed post here.

I hope you can attend the meeting Thursday evening- see you there!

New American Community Survey Shows Bike Commuting Explosion in Carrboro

Bike Corral on Weaver St (photo courtesy Carrboro Bicycle Coalition)

Bike Corral on Weaver St (photo courtesy Carrboro Bicycle Coalition)

There’s big news for Carrboro in the latest American Community Survey Data – bike commuting has really taken off in town in the last five years.

The most detailed, statistically reliable information we have on how people commute to work is now part of the American Community Survey (ACS). The ACS collects data every year, but has the greatest validity and reliability in its 5-Year Estimates.  In December 2015, the Census Bureau released the 5-Year Estimates for 2010-2014, allowing for the first time ever a comparison to the 2005-2009 5-Year Estimates.

Here’s what the data tells us:

  • Workers age 16 or older living in town increased from roughly 10,100 to 11,900 between the 2005-2009 and 2010-2014 periods.
  • Percentages for travel mode to work in 2010-2014 were mostly similar to 2005-2009, with bicycle travel being the big change:
    • Drive alone travel to work rose from 60.6% to 61.6%
    • Carpooling fell from 13.0% to 11.2%
    • Public Transportation fell from 14.1% to 12.5%
    • Walking fell from 3.0% to 2.8%
    • Bicycling increased from 2.9% to 5.2%
    • Working from Home increased from 4.9% to 5.4%

The increase in people riding bikes is notable because it is a 79% increase in cycling over just five years’ time!  This is a big deal. When one thinks about the cities around the US that have some of the best bike infrastructure, Portland has a bike commute share near 7% and Minneapolis is around 4%. While college towns tend to run higher than other types of cities, it is still encouraging to see how many more people have felt comfortable riding around town.

Why Did This Happen?

The Census data does not tell us any reasons why Carrboro residents are increasingly choosing to bike, but my theory is that after many years of adding bike lanes here and there, the road diet on West Main St that was completed in summer 2013 was a real game-changer because it linked FIVE different bike lanes that previously functioned as islands with a high Level of Traffic Stress section in the middle that was a big deterrent to biking. See the graphic below for details.

Pre-Road-Diet: West Main St Bike Network Gap

Pre-Road-Diet: West Main St Bike Network Gap

I saw a significant increase in my bicycle usage after this segment went into place, as I felt less at risk from cars in the road dieted version of West Main than the original configuration.

The bottom line: investing in bike infrastructure works. As the Town of Carrboro continues to expand the bicycle network, and solve pinch points and troubling sections where “Interested But Concerned” cyclists feel unsafe, we will continue to see these great results.

Since this data was gathered the Smith Level Rd project, with brand new bike lanes up to BPW Club Rd and Carrboro High School, has opened, and the climbing lane for bikes under NC 54 along Jones Ferry Rd will also be complete in 2016. This suggests we still have room to grow.  I think 8.5% bike commuters is  good target for the 2019 ACS.  Let’s see if we can beat it.

Do you have a different theory for why people are riding bikes more than ever in Carrboro? Please share it in the comments!

Central Carrboro Traffic Went DOWN from 1997 to 2013

More People are Riding Buses, Biking and Walking in Carrboro

More People are Riding Buses, Biking and Walking in Carrboro

Did you know that many traffic counts in Carrboro were lower in 2013 than in 1997? Yep. In 1997, Carrboro was home to roughly 15,400 people. By 2013, the Census reported that number as closer to 20,800.

Despite adding over 5,000 residents and seeing downtown job growth, there were fewer cars on the streets all over central Carrboro in 2013 than there were 16 years earlier!

You can see for yourself by checking NCDOT’s traffic count maps at the end of this post. But let’s take a look at all the counts that went down, and those that went up. Out of curiosity, I also looked up a walkscore at a nearby address.

Traffic Counts from NCDOT that declined between 1997 and 2013


W. Main St by Chapel Hill Tire/Akai Hana (4% decline; Walkscore: 83)

1997: 4,700

2013: 4,500

N Greensboro between Short and Poplar: (8% decline; Walkscore: 86)

1997: 15,200

2013: 14,000

Rosemary St at Chapel Hill / Carrboro Town Line: (20% decline; Walkscore: 85)

1997: 10,500

2013: 8,400

W. Main St east of Blackwood: (26% decline; Walkscore: 55)

1997: 5,700

2013: 4,200

West Main between Lloyd and Main/Rosemary Split (30% decline; Walkscore: 91)

1997: 24,200

2013: 17,000

Main St between Greensboro and PTA Thrift (25% decrease; Walkscore: 86)

1997: 12,500

2013: 9,400

West Weaver St between N Greensboro and Center St (29% decrease; Walkscore: 86)

1997: 9,200

2013: 6,500

Traffic Counts that stayed the same Between 1997 and 2013

N Greensboro St just north of Blue Ridge Rd (0% decline/increase; Walkscore: 13)

1997: 6,000

2013: 6,000

S Greensboro between Carr and Old Pittsboro (0% decline/growth; Walkscore: 85)

1997: 12,000

2013: 12,000

Traffic Counts that went up Between 1997 and 2013

North Greensboro St between Morningside Dr and Hanna St: (6% increase; Walkscore:34)

1997: 6,600

2013: 7,000

Hillsborough Rd between Dillard and Greensboro St: (6% increase; Walkscore: 35)

1997: 1,600

2013: 1,700

Estes east of N Greensboro: (11% increase; Walkscore: 65)

1997: 12,600

2013: 14,000

Hillsborough Rd between Pine and Main: (8% increase; Walkscore: 65)

1997: 2,500

2013: 2,700

N Greensboro St between Weaver and Main: (22% increase; Walkscore: 91)

1997: 9,000

2013: 11,000

Jones Ferry Rd between Old Fayetteville Rd and NC 54: (4% increase; Walkscore: 42)

1997: 10,600

2013: 11,000

NC 54 between Old Fayetteville Rd and NC 54/West Main St Intersection: (18% increase; Walkscore: 42)

1997: 15,200

2013: 18,000

So what happened?

Carrboro invested in other ways of getting around. According to the recently released DCHC-MPO Mobility Report Card, Carrboro:

  • Increased sidewalk mileage by 24% between 2005 and 2013, adding 7 miles of sidewalk- making it easier to walk around town.
  • Increased bike lane mileage by 24% in the same period, adding 3 miles of bike lanes
  • More than doubled its mileage of multi-use paths to 3.8 miles in total
  • Had buses go fare free in 2002 on Chapel Hill Transit. Many of the places with declines are along major bus corridors in Carrboro on the F, J, and CW routes.

The Mobility Report Card also describes Main Street in Carrboro as one of the region’s leading “Multimodal Corridors” – places with more than 25% of trips that are not drive-alone trips. Trips on Main Street in 2012 were 57% by car, 6% by transit, 27% by walking, and 10% by bike.

When you give people viable choices for travel beyond the car, they use them.

Source data found here:

1997 AADT Counts – Chapel_Hill-Carrboro-1997-aadt

2013 AADT Counts – Chapel_Hill-Carrboro-2013-aadt

CB21 Exclusive: Jones Ferry Rd Mural Design Released, Public Hearing on Sept 1

Randee Haven-O'Donnell, Michael Adamson, Damon Seils

Randee Haven-O’Donnell, Michael Adamson, Damon Seils

While CityBeautiful21 is normally in the business of reacting to and commenting on news developments in Carrboro, today I have the opportunity to break some news – the design for the proposed mural on the wall near the Jones Ferry Rd and NC 54 interchange is being released in this blog post!

This week I had the opportunity to connect with Michael Adamson (MA), a longtime friend of Carrboro who has been shepherding the mural process along over the last two years, with significant contributions from BOA Members Randee Haven-O’Donnell and Damon Seils.  Here’s what he had to say.

CB21: First, where is this mural being proposed?

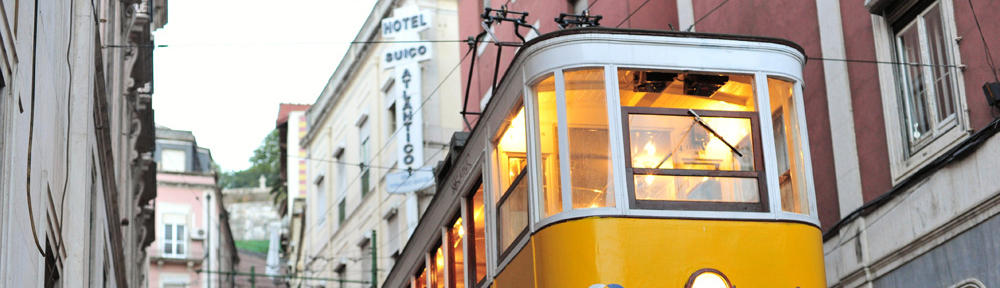
MA: The mural would be painted on a large wall facing NC 54 beneath the Collins Crossing (formerly Abbey Court) apartments near where the on/off ramps meet Jones Ferry Rd.  Here is a picture of the area from Google Streetview:

Proposed Mural Location Near Jones Ferry Rd

Rightmost wall face, facing off-ramp, is the proposed mural location near Jones Ferry Rd


CB21: Tell us a bit about how the idea of a mural at this location got started.

MA: It wasn’t my idea.  My daughter Catherine Adamson, who lives near the mural wall and commutes by it twice a day, said to me, “Dad, a mural would look really good on that wall.”  She suggested I take it on as a project.  That was in September, 2013.  I brought the idea to Art Menius (then director of the ArtsCenter) and Jacquie Gist (Carrboro alder).  They smoothed the way to working with the Carrboro Arts Committee and the very fine muralist, Michael Brown.  This was a complex project from the beginning because so many stakeholders were involved.  The wall belongs to the North Carolina Department of Transportation so they have final say.  And we wanted as much public input as possible, especially from kids who live in the neighborhood.

CB21:  This intersection functions as a gateway to Carrboro for folks coming from places due west, including Snow Camp, Saxapahaw, or even further away in the Triad. (Greensboro/Winston-Salem/High Point) Was there a message about Carrboro you hoped to send through the artwork in this location?

MA: There are really several messages.  One is the message of the process itself.  We are sending a message to school children and their parents that we care about them.  We want them involved.  We went to the local schools closest to the mural site and engaged about 160 third graders in drawing self-portraits.  They looked in a mirror and drew themselves.  Michael Brown used those portraits as the basic material from which he created the mural image.  No child can be identified from their portrait in the mural because the elements of the images have been mixed.  But the children know that they inspired the art.  That is the message to them.

There is another message to the other citizens in Carrboro and in surrounding communities.  The Town logo, which is at the center of the mural, tells everyone that this is Carrboro and that Carrboro cares about kids.  Carrboro also cares about diversity and this comes through in the fact that the portraits look like the kids, in all their variety and uniqueness.  We wanted every person who looks at the mural to see someone who looks like them.  The mural is a human rainbow.

CB21: You reached out to schoolchildren to generate material for the mural.  How did they arrive at the idea of doing the self portraits?

MA: Michael Brown is a former school teacher so he knew that it is a common art class assignment for kids in 3rd grade to draw themselves.  It’s a valuable exercise… part of learning about your own identity as you are growing up.  He suggested to the art teachers at Carrboro Elementary School and Scroggs Elementary School that their kids might be involved in a project that would benefit everyone.  Both teachers enthusiastically joined the project and the kids had a lot of fun.  Michael Brown taught lessons to the kids… lessons about the history or portraiture and the basic elements of art.  So the kids benefited directly and their art will live on for many years, seen by the passengers of more than 25,000 cars per day that pass the mural site.

CB21: Clearly there’s some math here. 100+ kids and you can’t fit all the portraits on the wall. Was it hard to pick ones to go in the final image?

MA: There are 7 portraits in the mural.  These are composed of elements from the self-portraits of the 160 children who participated.  This was in no way a competition.  We did not want children to be singled out or judged on the basis of their art work.  After all, these are 8 and 9 year old children.  So it’s not about competition. It’s about having fun and doing the best art you are capable of.  Some children will recognize an element in the mural that seems to come from their own art work.  But there is no way to trace the final mural image back to any particular child.

CB21: Muralist Michael Brown, who has a tremendous body of work on local walls in the area, is involved.  Tell us about his role.

MA: Michael Brown is the creator of the mural.  He used the children’s self-portrait art as his inspiration, but he is the real source of the mural.  Michael Brown and I have a great working relationship.  I think that’s precisely because I have no artistic talent.  I don’t pretend that I can contribute to the art itself.  Michael Brown lets me take care of guiding the project through the process.  Michael Brown did all the presentations to the Carrboro Arts Committee where the final image was decided on.  And he will do the actual painting of the mural.  We wanted to involve the children in the painting as well as the image creation process, but that was not possible at this site due to safety concerns.  We hope that in the next phase of the mural we can have everyone in Town involved in the actual painting.

CB21: How is this project being funded?

MA: The mural has been granted $8,000 in funding from the Carrboro Tourism Development Authority.

CB21:  On September 1st there is going to be a public hearing at the Carrboro Board of Aldermen meeting.  What input are you and others involved in the mural process are you seeking?

MA: Well, first of all we want to make everyone aware of the project.  The hearing will give folks a chance to learn about how the image was created and ask any questions they have about the art itself as well as the process of putting paint on the wall.  People who come to the hearing can speak to the Board of Aldermen and express their opinion about the project and the art itself.

Public art has a purpose.  That purpose is to stimulate people who see it to think and feel.  And when people think and feel, that can cause controversy.  Maybe some people will not like having a mural at this location. Maybe some people will not like the art work.  It is rare to have any piece of art that is liked by everyone.  The Carrboro Arts Committee reviewed the project and selected the particular image that we are proposing.  And that committee is very representative of the arts community and the Carrboro community as a whole.  But everyone has a right to their own opinion and a right to express that opinion.  So we want folks to speak their minds.  If you like it, say so.  If you don’t, say so.

CB21: This is the first phase of the Carrboro Mural Project, but there are two more phases to come in the future.  Tell us about those.

Yes, this first phase, which includes the Town logo, faces NC 54 and will be seen by many thousands of people every day.  It is a simple, low resolution image that can be viewed as you pass by at the speed limit, which is 45 miles per hour.

The next phase of the project will be on the adjoining wall which faces Jones Ferry Rd.  We don’t know exactly what image will be on that wall.  It is also going to be viewed by moving traffic at a distance, but the cars will be moving slower and will be closer to the image, so perhaps we can have more detail in that image.  The big difference with phase 2 is that there is a grassy lawn area in front of the wall.  We hope this will make it safe to have regular citizens (and not just professional artists) involved in applying paint to canvas.  The whole Town could be involved in painting.

And the third phase of the project will be on the wall along the Jones Ferry side walk.  This will viewed by people standing still just a few feet from the wall, so we can have very high definition art on that wall.  We hope to “panelize” that wall so that it can hold 25 go 30 separate art projects.  And hopefully each of these can be designed and painted by citizens of Carrboro.

We hope that the first phase will be painted this Fall.  In coming years, the other two phases will become reality so that Carrboro will be known for the very fine public art that graces the Jones Ferry gateway to the town.

CB21 Commentary:

In closing, I’m grateful to Michael Adamson for taking the time to discuss the mural, and I encourage CB21 readers to attend the public hearing On September 1st at Carrboro Town Hall. Personally, I support the mural for a variety of reasons, but the primary reason is that it represents the expression of a core value in this town:  the notion that within everyone is the capacity for art, and that Carrboro is a place that gives everyone the opportunity, space, and freedom to be a contributor to that culture.   Anyone wanting to find out more can visit the Carrboro Mural Facebook Page. Without further ado, here is the final mural image by Michael Brown! (Click to enlarge!)

Final Carrboro Mural Image

Final Carrboro Mural Image

Key Take-away From Summer Streets: It’s Time For Autumn Streets

Sunday, July 19th, from 8:00 am to 2:00 pm, Carrboro held its second “Summer Streets” (Herald Sun article) event, in which the block of Weaver St between Main St and North Greensboro St was opened to people and closed to cars. For the umpteenth time in the decade and a half I’ve lived here, the Town closed this portion of Weaver Street with no visible negative impacts to traffic or downtown in general.

As usual, people came out and enjoyed a calm public space, kids drew with chalk, and everyone generally had a grand time relaxing, even with 100-degree heat index temperatures.  People did yoga, hung out in folding chairs just talking, and one of our Aldermen even held “office hours” for the second time during such an event.

What does opening a street to people do for a town?  Stuff like this:

Kurt Stolka and his 3-year-old son walked around Weaver Street after playing a game of soccer in the street.

He said when there is traffic on Weaver Street, “I just can’t feel calm letting my kids play. You have to constantly keep an eye on them.”

But the Summer Streets program helps parents like him relax, he said.

Safe, Happy Kids Dancing on Yellow Lines

Carrboro Summer Streets: Safe, Happy Kids Dancing on Yellow Lines

Kurt is absolutely correct. I took the picture to the right at the 2012 Carrboro Music Festival. I was able to take this photo because I did not have to hold DC’s hand in a vise grip in downtown Carrboro to provide protection from the greatest danger to children, cars. Why is this so important? Sure, I can take DC to Wilson Park, Carrboro Elementary School, McDougle School, or MLK Park and take advantage of any of the stuff there in the same way, but none of those places have the amenities of downtown in terms of food, commerce, and culture.

Back in May, WCHL reported that the Town was only going to hold three Summer Streets events, and to end them at 2:00 pm each time. This was due to concerns from “…local business owners inside Carr Mill Mall who don’t love the idea. They worry the street closures will keep shoppers away from the mall.”

Given the people-attracting quality a street closure can provide, I was baffled by these concerns. Fortunately, the latest Herald-Sun article reports:

“…[Carrboro Economic Development Director Annette] Stone said that after last month’s event, she sent out an email to business owners. She said she didn’t receive any negative responses and several businesses expressed support for the program.

Seeing as there appears to be broad agreement that there’s not problem here, let’s not take any more half-measures in managing what could be one of our community’s marquee public spaces- let’s set up an “Autumn Streets” program that starts the first Sunday in September and runs EVERY SUNDAY until the Sunday before Thanksgiving, from 8:00 am to 9:00 or 10:00 pm.

That would be twelve glorious autumn days to come downtown and relax, and twelve other great opportunities to try ways to program the block to engage residents. There are plenty of tourism co-promotion opportunities between UNC football games, 2nd Friday Art Walks, etc to take advantage of as well to engage visitors.

If you think this is a good idea, please email the Carrboro Board of Aldermen and let them know “I support weekly Autumn Streets!”

Filtering, Housing Supply and Changes In Rents: The Evidence

Over the past two weeks, I have highlighted how housing prices and rents increase without new development-  through filtering at large multifamily properties and at smaller rentals as individual landlords decide to upgrade their units one at a time. The flip side of this phenomenon is the question:  Is there is evidence that expanding the supply of housing can put downward pressure on rents, and can prevent mid-market housing from filtering up to become higher-end rental property?

The answer is an overwhelming YES.  But don’t take my word for it, just read a whole bunch of newspaper articles with data below. None of them use the word “filtering” explicitly, but virtually all of them reference filtering in housing markets in one way or another. I’ll make some brief comments after a few articles.

Austin, TX – 2/2/2015 (Austin American-Statesman)

The boom in apartment supply dropped the area’s occupancy rate to 94 percent in the last half of 2014 — the lowest occupancy level in more than three years, and nearly 4 percent below the recent high of 97.8 percent in June 2012…With all those new units entering the market, supply is catching up to demand. And that means apartment rents are stabilizing after rising rapidly — sometimes as much as 7 percent per year — from 2010 through 2013. The average rent in the metro area was $1,107 a month in December — an all-time high, but an increase of only $8 from the average rent for June, Heimsath said.

Comments: This article notes how the expansion of supply in Austin has increased vacancies, which is another way of saying there are more multifamily properties with idle income-producing units each month, who are now more likely to make deals on rent. Here the supply of new units has cut rent increases from 7% to 0.7%- or $8/month on a unit that rents for $1,107.

Washington, DC – 1/4/2015 (Washington Post)

This new supply forced landlords at some four- and five-star buildings to reduce rents in order to fill their units. As a result, rent growth dipped into the red briefly in 2008, and then again for most of 2009. The Great Recession also had an impact, as some former four- and five-star renters moved to older, cheaper three-star buildings to save money. This increased demand for three-star units, allowing landlords there to continue raising prices.

In recent years, the effective rental growth rates of three-star and four- and five-star buildings have diverged even further. Just as in 2007, this is largely a result of the recent construction boom in the Washington area. An unprecedented number of new apartment units (about 24,000) have arrived in the area in the past two years, increasing the total apartment inventory by roughly 5 percent.

That new supply wave cut rents for four- and five-star apartments even further, even as rents at three-start apartments continued to outperform. But the narrowing may be slowing as the wave of supply takes its toll on three-star rents as well, working in renters’ favor.

Comments: This article identifies some of the submarkets in DC, separating out 3-star properties from 4-star and 5-star properties, and describes how the influx of new high-end units has had rents falling since 2013. (see chart) Also of interest are the descriptions of people moving from one submarket to another because of the Great Recession.

Closer to home, a piece on the Triangle Apartment Market as a whole – 11/19/2014

A total of 7,965 new apartment units have been completed in the Triangle over the 12-month period ending in September, according to MPF Research, which analyzes apartment data in 100 U.S. metro markets. That is easily the largest amount of new supply added over a 12-month period in the 20 years that MPF has been tracking the Triangle.

According to MPF, demand for new units over that same period totaled 6,940 – a hefty number but still below supply.

The new supply has helped slow rent growth in the Triangle. Rents were up 1.7 percent in the third quarter compared to the same period a year ago. That was well below the 3.7 percent average increase across the United States.

Comments: Pretty self-explanatory. More units coming online slowed rent increases compared with national averages.

More local data, in Durham – 2/14/14

The boom in apartment construction in Durham County and across the Triangle has helped to bring down average rental rates, according to a recently released report from the Charlotte-based market research firm Real Data.
However, a real estate company behind one of the new apartment complexes in downtown Durham expects to be able to buck that trend due to the location and type of product it’s offering.
Across Durham County, the average rental price per unit in January was $887. That was down 2.3 percent compared with the average in July of last year. That’s a larger decline than was seen in the three Triangle counties of Wake, Durham and Orange, where the average was down 1.7 percent to an average rate of $868 per month.
Vacancies have risen as some of the units in the new complexes have come online, the firm reported. Real Data had a total of number of 3,045 units under construction in Durham County, which is 30 percent of the number of units – at 10,028 – under construction across the Triangle.
Although averages are coming down, according to the firm’s reporting, it appears that the newer units are being rented out at the expense of older communities. Existing communities saw a net loss of 306 renters across the Triangle, according to Real Data, while there was a positive net unit absorption of 1,436 units.

Comments: The last sentence (emphasis added is mine) is a perfect description of filtering with new units attracting high-end submarket renters to the newest, latest/greatest housing.  This raised vacancies at existing multifamily properties,and rents fell 2.3 percent across the market, making housing more affordable.

And in Chapel Hill on Rosemary Street – 3/31/2014

Students stood in line with keys outside of the LUX apartments leasing office on Franklin Street Thursday hoping to open a treasure chest that would give them free rent for a year. At one point they were approached by two people handing out treats with advertisements for The Warehouse on them.

“I incorrectly thought it was LUX employees trying to pacify people who were waiting in line, but I was wrong,” UNC student Lauren Sutton said. “I got my rice krispie treat and flipped it over and there was a sticker on it saying, ‘Warehouse apartments: Now Leasing,’ and their prices for rent.”

The Warehouse did not return requests for comment.

But the complex did lower its monthly rent for four-bedroom apartments to $618 for next year, down 21 percent from $785 this year, according to the complex’s website.

Comments: Classic response to visceral competition from brand-new amenity rich building directly across the street- move your rents to a new, lower-rent submarket to compete!

You see that there are all kinds of affordable cities in the United States. There are plenty of low-demand cities, especially in the midwest, where the housing stock has grown slowly and prices are low. But there are also plenty of cheap, fast-growing cities in the sunbelt where the housing stock is growing rapidly and keeping things affordable.

 And then there are the expensive cities. The places where house-sellers are asking for over $200 per square foot. All of them are cities where the housing stock is growing slowly, even though these are the places where it would be most profitable to build. That’s because these cities tend to have geographical constraints that prevent further sprawl, and have adopted zoning codes that make it difficult to add more housing by building more densely.

Here’s the chart, courtesy of Trulia.com:

No Expensive Housing Market Builds Much HousingAs I was working on this post over the last few days, I was trying to put together a good summary paragraph when an excellent blogger in Chicago, Daniel Kay Hertz, took up the same topic and posted this excellent conclusion for affordability:

But the bottom line is that slow, zero, or negative cost-of-housing growth is better than fast cost-of-housing growth. (At least, that is, in high-cost neighborhoods/metropolitan areas.) The vast majority of low- and moderate-income people live, and will continue for the foreseeable future to live, in non-subsidized housing. Even in New York, which has held on to its public housing better than most other large expensive cities, it only makes up something like 7% of all units. That means that it’s exactly these kinds of market trends – consistently large rent hikes, year after year, in mid-ish market housing – that makes a neighborhood, or city, or metropolitan area, eventually unaffordable to working- and middle-class people.

And it turns out that construction booms arrest that sort of pattern, or prevent its continuation, all the time.

Displacement Without Development: Filtering Up on North Greensboro Street

Last week I described the real estate market phenomenon known as “filtering,” and discussed a recent example in Carrboro where Abbey Court filtered from a lower rental submarket to a higher rental submarket and became Collins Crossing.

Displacement Without Development

Today I’m going to discuss another local example of where lower-rent units are disappearing and higher-rent units are taking their place. As you continue reading, keep in mind what is ultimately the most important part of this post – that new development is completely absent from the neighborhood real estate market, and yet rents are rising. When rents in existing buildings are rising, the socioeconomic status of the people living there is going to change. (as we saw last week)

Since properties filtering up and down is driven by the decisions of many individual landlords, a lot of filtering happens one property at a time, and thus can be hard to spot.  However, Carrboro has one smaller-property hotspot for filtering up these days: North Greensboro Street, just north and south of Estes Drive Extension.

Let me show you what I mean, and also show you the best free software tool available to track filtering visually: Google Street View.  If you look at the date of any Google Street View photo and see a clock to the left of it, that means there should be older views available as well.  For neighborhoods currently seeing changes and investment, this is a great way of doing before and after comparisons.  With that in mind, let’s explore North Greensboro Street in Carrboro in the pictures below.

Filtering On North Greensboro Street

Here’s 1103 North Greensboro St in 2007:

1103 N Greensboro St, 2007

1103 N Greensboro St – 2007

and “The Wilson” in 2012 (same property)

"The Wilson" - Apts in 2012

“The Wilson” –  2012

From a website attempting to sell The Wilson for $2.3 million for its 16 units- the smallest unit is a 2BD/1 BA renting for $905/month for 700 square feet:

The Wilson Apartments are located 1.5 miles from the UNC campus and the commercial hub of Franklin Street in Chapel Hill. The property has been completely renovated with condo quality finishes that include stainless steel appliances, updated baths, hardwood floors and a new metal roof.

Also from their website, here are the improvements the owners of The Wilson made to move to a higher-end rental submarket

  • Removed baseboard heat & window a/c’s and installed central heat and air in all 16 units – new heat pumps
  • Removed old shingles, replaced old plywood and installed a new energy efficient standing seam metal roof
  • Removed all the original single pane windows and installed new Pella low-e vinyl windows
  • Completely renovated every kitchen; new cabinets, counters, sinks, and appliances – stainless refrigerators with ice makers, ranges, built-in microwaves
  • All new bathrooms including, tubs, showers, vanities, cabinets, lighting, mirrors and accessories
  • Installed all new plumbing lines and fixtures inside every unit, sub-meters were installed on some of the units, but are not being utilized at this time
  • Installed new main sewer line from buildings to the street
  • Removed the laundry room and installed new, energy efficient stackable washers and dryers in every unit
  • Painted the exterior brick and re-painted all the interiors
  • Refinished the existing hardwood floors and “feathered in” new hardwoods in the living and bedroom areas – tile floors installed in the baths
  • New interior and exterior doors with new hardware
  • Completely demoed and re-wired all units and the common areas – replaced lighting fixtures with new
  • Made alterations to floor plans which include, but are not limited to; adding bedrooms (converted 6 units from 2 BD’s to 3 BD’s), removing dividing walls
    between kitchens and living areas, creating arched doorways, vaulting the 3rd floor ceilings and capturing common area space (previously un-used) to make
    some units larger
  • Upgraded the landscaping in the courtyard with new plantings and accents,removed overgrowth at the front of the property and planted new trees and shrubs, removed debris and thinned out the woods in the rear of the property to create and view and path to Wilson Park
  • Added three new porches with standing seam metal roof, all new wood handrails with cedar trim accents and arched pergola in courtyard
  • Tore down, graded and re-built the retaining wall on the left side of the property
  • Graded and added gravel in the rear of the property to create more parking spots
  • Built new property fence along the street and dumpster containment area


Remember that year you spent in grad school at the aging Todd St apartments?

Todd St Apartments, Mid-Renovation, 2007

Todd St Apartments, Mid-Renovation – 2007

It’s now known as “The Flats.”

"The Flats" - 2012

“The Flats” Condominiums – 2012


Here’s a picture of the kitchen and laundry area in one of The Flats units that recently sold for $193,000 according to Zillow.  Notice the stainless steel appliances, double-stack modern front-loading laundry equipment, and new counters.  This building was built in 1962, but the inside screams 2010 or newer.

The Flats Kitchen/Laundry Investment

The Flats Kitchen/Laundry Investment

One of the more recent conversions is 605 North Greensboro. Here I have put the before and after shots side by side- one from Google Street View, and another photo I took last year.

605 N Greensboro Filters Up in Carrboro

605 N Greensboro Filters Up in Carrboro


Like many other buildings on the street, 605 N Greensboro now has a name- “Sagebrush,” to signal its upmarket transition.

What Filtering Means for Carrboro and Affordable Housing

In a world where not enough housing gets built to meet market demand, the demand for luxury and high-end-of-the-market housing in a growing metropolitan area will turn middle market units into upper market units via renovation. This is exactly what is happening on North Greensboro Street.

If new housing is built, and it is luxury housing, it will entice some residents seeking a luxury housing experience out of their current units, freeing up those units for  renters with a little less income to take their place.  This helps put downward pressure on prices through the basic law of supply and demand.

The flip side of this point is that if Carrboro produces a limited amount of new housing units, then the town has adopted a de facto policy to encourage filtering up in various submarkets of the existing housing stock. The landlords on North Greensboro Street have figured this out, and they are making rational capital investments in their rental businesses.

As the Board of Aldermen continue to discuss affordable housing strategies, it is important that they and town staff be aware of filtering occurring in town at large properties (like Abbey Ct/Collins Crossing) and smaller ones (like North Greensboro St), and they think about how to channel the reasonable and natural impulse of landlords to filter their properties up and down to support the town’s broader housing goals.

Filtering: A Word We Need to Understand as We Discuss Affordable Housing

Protest of Abbey Court Sale to ASM

Protest of Abbey Court Sale to ASM (photo courtesy of www.chapelboro.com)

When new development occurs in Carrboro, many people ask “how many of the new residential units are going to be affordable?”  While this is a good question to ask, the new units in any project are inevitably a small portion of the overall housing stock in the town.

The more important question is “how many of the EXISTING units are becoming more or less affordable?”

New Development = Small Portion of the Housing Supply

The 2012 American Community Survey reported that Carrboro had 9,347 housing units.  A recently approved project on North Greensboro Street, Shelton Station, will add 96 units to the town’s supply of housing, which is barely over 1% of units.  The debate over a single project’s affordability can make it seem like the prices of the other 99% are affordable, or at least have prices that are holding steady.  This is not the case.

Landlords Respond to Rent Conditions and Trends

I’ll let Chris Bradford, the eloquent blogger behind Austin Contrarian, explain this part:

When property values rise, low-quality housing “filters up” to the high-quality housing sub-market.  The reason is that rising rents encourage landlords to invest more in the property.  When property values fall, high-quality housing “filters down” to the low-quality housing sub-market.  The reason is that falling rents encourage landlords to invest less in property.  The key in either case is that old housing costs more to maintain than new housing.

He continues:

Every landlord with an old property confronts the same decision:  Should I spend the money to keep the property in top shape, or should I let it go?

Keeping the property in top shape allows the landlord to charge more rent.  But it also costs the landlord more in maintenance and periodic renovation, especially for old apartments.  What the landlord decides to do depends on the current market, his estimate of future demand, and about a million other things.  But we know one thing for sure:  A landlord is less likely to maintain an apartment in tip-top shape when the rent for tip-top apartments is falling.  Declining rents mean a declining return on the maintenance investment.  That spells less investment .

Without constant maintenance, apartments deteriorate from “tip top” to “slightly dilapidated.”  Renters, sensible people that they are, are not willing to pay as much for bad quality.  Rents fall, and the apartments “filter down” into the pool of affordable housing.

Filtering Moves Units From One Housing Submarket to Another

In another one of Bradford’s posts on filtering, he goes on:

People understand that a tight housing market leads landlords to raise rents. What they often don’t seem to understand is that a tight housing market also causes some landlords to invest more money in their properties in order move them into a more expensive submarket. That’s how a shortage of units in the $1,200/month submarket (for example) can hurt someone shopping in the $800/month submarket.

This is a key point about “filtering up.”  If there’s a demand for higher-end units in a market that is not being met, middle-market landlords who realize this are likely to invest in their properties and re-position them as higher-end units.  This often comes in the form of fresh paint, premium kitchen appliances and countertops, and other modest-cost improvements such as better light fixtures and new carpets.  Once these conversions take place, the landlords will then start charging higher-end market rent for their unit, and simultaneously shorten the supply of mid-market apartments by one unit.

Bradford touches briefly on “filtering down,” and makes a good point:

Filtering down happens too, of course. It’s just that no one sends a press release to the Austin Business Journal when they decide to cut back on maintenance and allow their property to slip in to a cheaper submarket.

What’s The Most Prominent Example of Filtering In Carrboro?

One particular property in town has had a place in the spotlight as it has gone through filtering changes in the last few years: Collins Crossing, formerly known as Abbey Court.  While the story cannot be completely told using news clips, the following quotes suggest that Abbey Court was “filtering down” through neglect from the middle of the past decade to the time of its sale to Aspen Square Management, and the new management firm has been renovating units, repositioning the property as a student-centric location, and “filtering up” to a higher-rent submarket ever since. Units that once rented in the mid-$500 range a few years ago now rent for more than $900 after the renovations.

June 2012: Abbey Court Sold [emphasis added]

While Blau acknowledges that renovations to the condominium complex are desperately needed to bring things up to code – citing buildings that are unsafe and stairways that are falling apart – because a large percentage of the residents who live in the condominium complex are immigrants, she is concerned that renovations could price them out of the complex.

January 2013: Abbey Court child falls through staircase  [emphasis added]

A 10-year-old boy tumbled through a deteriorated stairway at the complex on Nov. 24, three days after Collins Crossing owners notified condo owners of their plan to impose assessment fees.

Carrboro officials gave owners 90 days to make repairs. In the meantime, condo owners have to find the cash within three weeks. It’s unclear what penalty tenants will face if they don’t pay, although Carrboro Mayor Mark Chilton says management could impose a lien on the condos. Some residents fear foreclosure.

March 2014: Glowing reviews about Collins Crossing Landscaping on Yelp: [emphasis added]

I moved in right before school started last fall. The landscaping is great and the renovated apartments are awesome. I have so much room/closet space, other then having a tiny sink, the bathroom is perfect. The staff is always more then accommodating, they are some of the nicest women ever.  The prices are going up but still quite affordable and the best part is that you can have separate leases. I would definitely recommend this place.

Current (Jan 2015) Collins Crossing Website:

The UNC is our fully renovated 2 bedroom 2 bathroom apartment. It is an ideal floor plan for roommates within biking distance to UNC. It also features a full sized stackable washer and dryer.Starting at $979.

Housing Markets Are Dynamic, And Don’t Require New Development to Experience Price Changes in Submarkets

Carrboro has not seen significant new residential construction over the last several years, and Abbey Court/Collins Crossing is a good case study of how real estate market conditions, independent of the presence or absence of new development- drive how properties can become less affordable.

While the change from Abbey Court to Collins Crossing received significant coverage in the media, in part due to the size of the complex, this is not the only part of town that is filtering up.

Next Tuesday’s post will cover another key location where filtering is presently going on in Carrboro.  Have a guess about which part of town it is? Leave it in the comments, and check back on February 24th to see if you got it right.

Getting Terms Right: At Its Core, The Word “Urban” Is About Life On Foot

Editor’s note: I originally published this post on February 18, 2013, but there’s been a lot of discussion about density, urbanity, and quality of life in local media recently, and I thought it was worth re-publishing this.

Original post below:


On this blog, I’ll be discussing a variety of topics regarding questions of town-building for Carrboro, North Carolina and other places. But one I’ll probably come back to again and again is the word “urban.” Knowing that, I want to be as clear as possible about what I mean when I use this term.

In growth debates, this tends to mean a lot of things to a lot of people. More than a few people hear “urban” and immediately think “Manhattan” or “New York.” Interestingly enough, I think that when people say New York, they actually do mean “Manhattan,” and not Brooklyn, Queens, or any of the other boroughs. They are thinking of super-tall buildings first and foremost, and Manhattan has the highest concentration of skyscrapers in one place in the USA.

Others think more broadly of large cities with very large populations, places that generally have over one million inhabitants in a single municipality. This definition can encompass neighborhoods and communities of very different physical character. It may include skyscraper districts, mid-rise districts, and low-density neighborhoods often found 3 to 10 miles from an American city center.

However, I think the definition of urban can be made very simple, and most accurate, by tying it to one function: walking. Here is the simplest definition I can offer:

If you live, work or visit somewhere that numerous people regularly walk from one place to another for a variety of reasons other than recreation or exercise, then you are living in, working in, or visiting an urban place.


Christopher Columbus Park, Boston

Christopher Columbus Park, Boston – a Place for Walking


This is really the key to figuring out if a place is urban or not. Fundamentally, I believe that once we have stopped talking about agricultural landscapes and communities where farming is a principal activity, we are better off organizing our communities around urban principles instead of not doing so. This blog will be about explaining why I think this is true, and how we can build cities and towns full of beautiful urban neighborhoods.

With that in mind, what are some of the primary reasons why we should build urban places?

1. Health of Individuals. Getting around on foot rather than in a car provides significant health benefits. Most doctors will tell you that walking is close to “the perfect exercise” – low impact, able to be participated in for most of one’s life, and requiring little special equipment or money to participate. A community that makes it safe, easy and pleasant for people to walk for non-recreational purposes is one that is investing in the long-term health of its population.

2. Health of Shared Common Resources. Initiatives that convert auto trips to transit trips and particularly bicycle and walking trips lower a community’s per-trip air pollution and per-trip carbon footprint. Developing in a more compact growth pattern, by putting more uses and residents within walking distance of each other- reduces development pressure on farmland and on land around water resources.

3. Reduced Lifecycle Costs for Infrastructure. If we build 150 homes on 450 acres (1 home per 3-acre lot) then attaching those homes to a local sewer system such as OWASA will require a network of publicly maintained pipes that provides drainage across 70 percent of one square mile. Building those same homes at 15 dwelling units to the acre means that any expanded sewer network will need to cover 1.6 percent of one square mile. Joe Minicozzi of Asheville has probably done a better job than anyone documenting this issue.

4. A Healthy, Innovative Local Business Ecosystem A compact, reasonably dense neighborhood can support its own district of small businesses. Finer grain block sizes in city streets inherently lead you away from big-box retail owned by large corporations and international investors, and towards smaller format stores with a greater likelihood of a local owner running the business. Greater population densities create opportunity for greater variety in dining choices and for agglomeration benefits in many industries.

5. Vibrant Public Spaces By building compactly and in an urban pattern, one of the best outcomes is the ability to create special places that people cherish because they function as social centers as well as perhaps cultural or artistic centers. Locally, the Weaver Street Market Lawn is the best example of such a place.

Carrboro Music Festival

A Latin Dance Band gets the crowd moving on the Weaver Street Market Lawn at the 2012 Carrboro Music Festival.


Whether you’re a local elected official, a developer, or a citizen, if we’re going to build better urban places, it’s always good to ask – “is this proposed change going to help or hinder Life On Foot in the neighborhood and the town?”